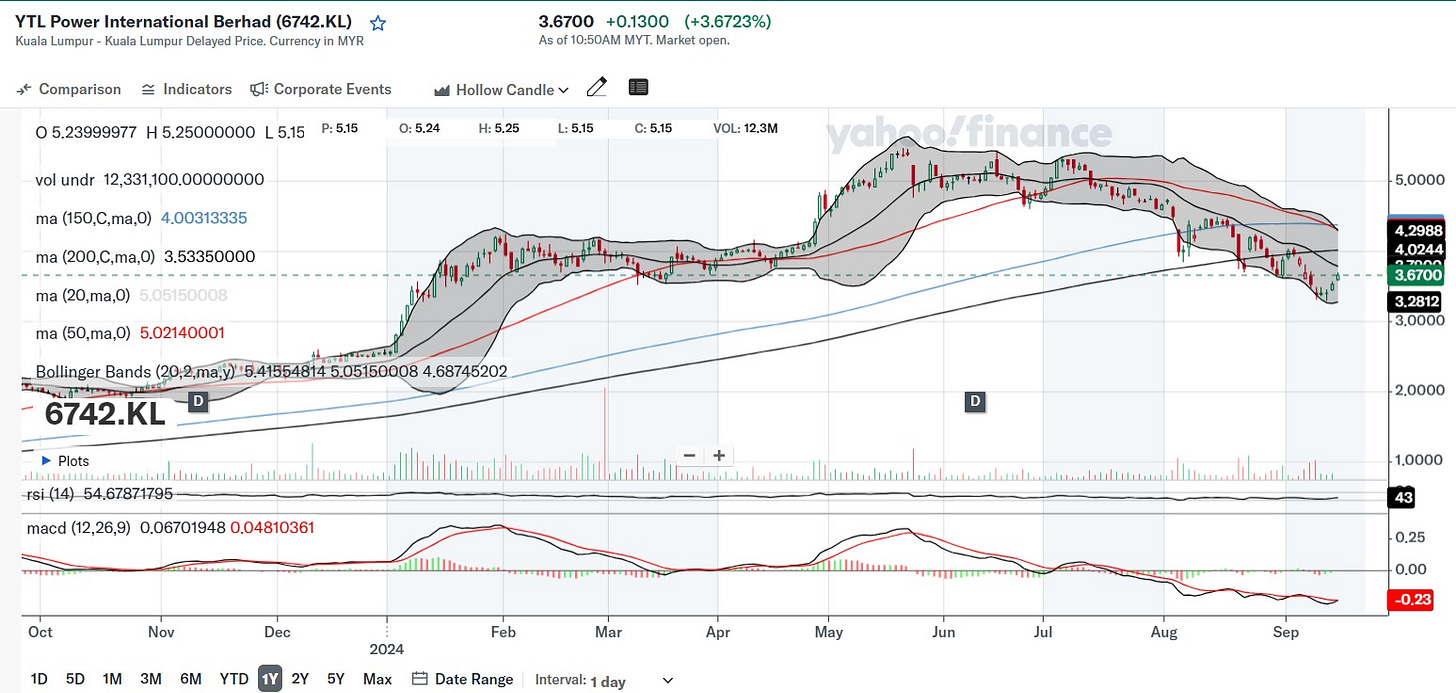
YTLPOWER: Slingshot Mean Reversion In Play?
Overall: Short-term Bullish but Long-Term Cautious
The stock is in a downtrend, with prices below all major moving averages and the MACD indicating continued bearish momentum.
However, being near the lower Bollinger Band suggests a potential for a short-term bounce, though this isn't strongly supported by other indicators.
Current Price and Trend:
The stock is currently trading at MYR 3.67, below its 20-day, 50-day, 150-day, and 200-day moving averages. This indicates a bearish trend as the price is below all key moving averages.
Bollinger Bands:
The price is near the lower Bollinger Band, which can suggest that the stock is oversold and may be due for a rebound. However, it's important to note that the bands are currently wide, indicating high volatility, which might also suggest that the downtrend could continue.
RSI (Relative Strength Index):
The RSI is around 54.68, which is in the neutral zone. This suggests that the stock isn't in overbought or oversold territory, providing no clear signal on immediate movement.
MACD (Moving Average Convergence Divergence):
The MACD is slightly negative, and the signal line is above the MACD line, which is a bearish signal. This indicates that the downward momentum could continue.