Top Glove: Consolidation or Breakout?
Overall Technical Verdict:
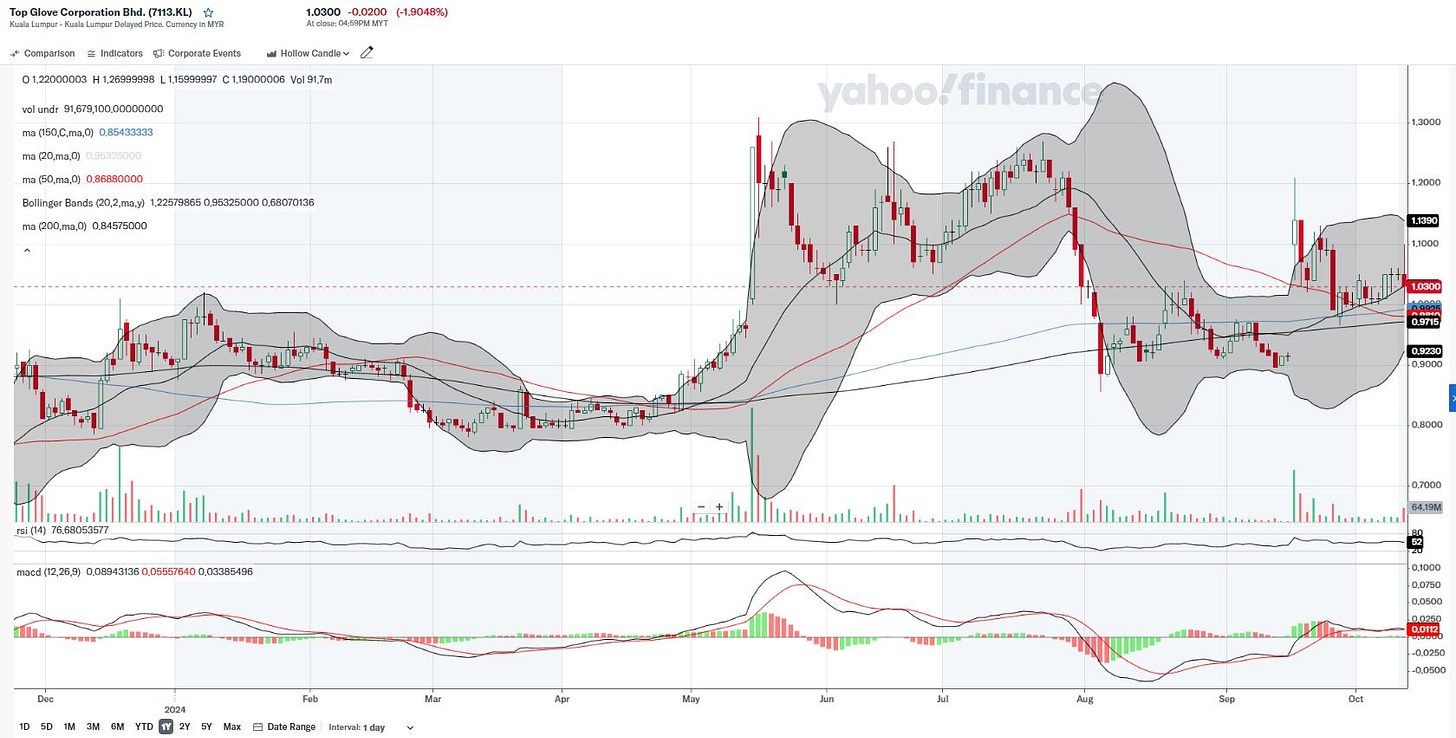
There are mixed signals, with some indicators showing potential strength (Bollinger Bands, moving averages), but others suggesting caution (RSI, MACD, and volume). The stock appears to be in a consolidation phase with a potential squeeze, but there is no clear breakout signal yet.
This setup might appeal to traders who are looking for consolidation breakouts, but caution is advised as it’s not yet showing strong momentum in either direction.
Fundamental News:
The company announced its Q4 FY 2024 earnings on 10-October. Top Glove's latest quarterly results show a significant improvement. For Q4 2024, revenue surged by 75% year-on-year, reaching RM835 million. The company posted a profit after tax of RM8 million, a dramatic recovery from losses, driven by increased operational efficiency and strong sales growth in the U.S. market, which saw a 120% jump in glove sales.
For the full financial year 2024, revenue increased 11% to RM2.52 billion, while losses after tax were narrowed to RM18 million from much larger losses in the previous year. The company anticipates further sales growth, particularly with rising tariffs on Chinese-made gloves in the U.S., which could boost demand for its products
Source: Bernama and The Sun
Details of Technical Analysis
Moving Averages:
The stock is interacting with several key moving averages (50, 100, 150, and 200-day moving averages). The 200-day MA is acting as support, while the price is currently around the 50-day MA. This can indicate a potential consolidation phase or a reversal. However, there isn't a clear crossover signal between short and long-term moving averages.
Bollinger Bands:
The Bollinger Bands are contracting after a recent expansion, suggesting the possibility of a volatility squeeze. The price action is currently close to the middle of the bands, which might indicate indecision or consolidation, but it doesn't show an immediate breakout signal.
MACD:
The MACD is near the signal line, showing a potential bullish crossover. However, the MACD histogram is slightly above zero, indicating weak momentum. It doesn't strongly indicate a bullish or bearish trend.
RSI (14):
The RSI is currently around the 50 level, which is neutral territory.
Volume:
There was a recent spike in volume during a sharp move upward, but volume has tapered off since then. Declining volume could indicate that the strength behind the recent rally is fading.


