Technical Outlook for S&P500, NASDAQ, STI and FBMKLCI
S&P 500 Technical Outlook: Maintain Bullish
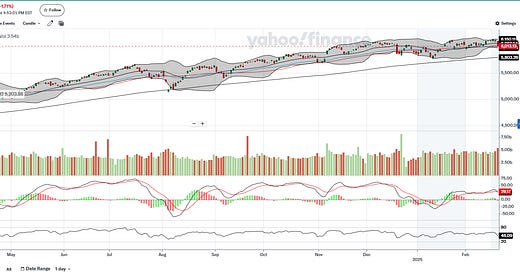
The S&P 500 chart exhibits a strong uptrend, trading above key moving averages (20, 40, 50, 150) with price action contained within Bollinger Bands. However, the recent dip suggests short-term selling pressure. The RSI at 76.9 signals overbought conditions, increasing correction risk. The MACD remains positive …
Keep reading with a 7-day free trial
Subscribe to KingKKK’s Substack to keep reading this post and get 7 days of free access to the full post archives.


