SUNWAY's Uptrend: Consolidation or Continuation?
This post is only available to Substack subscribers.
Overall Technical Verdict:
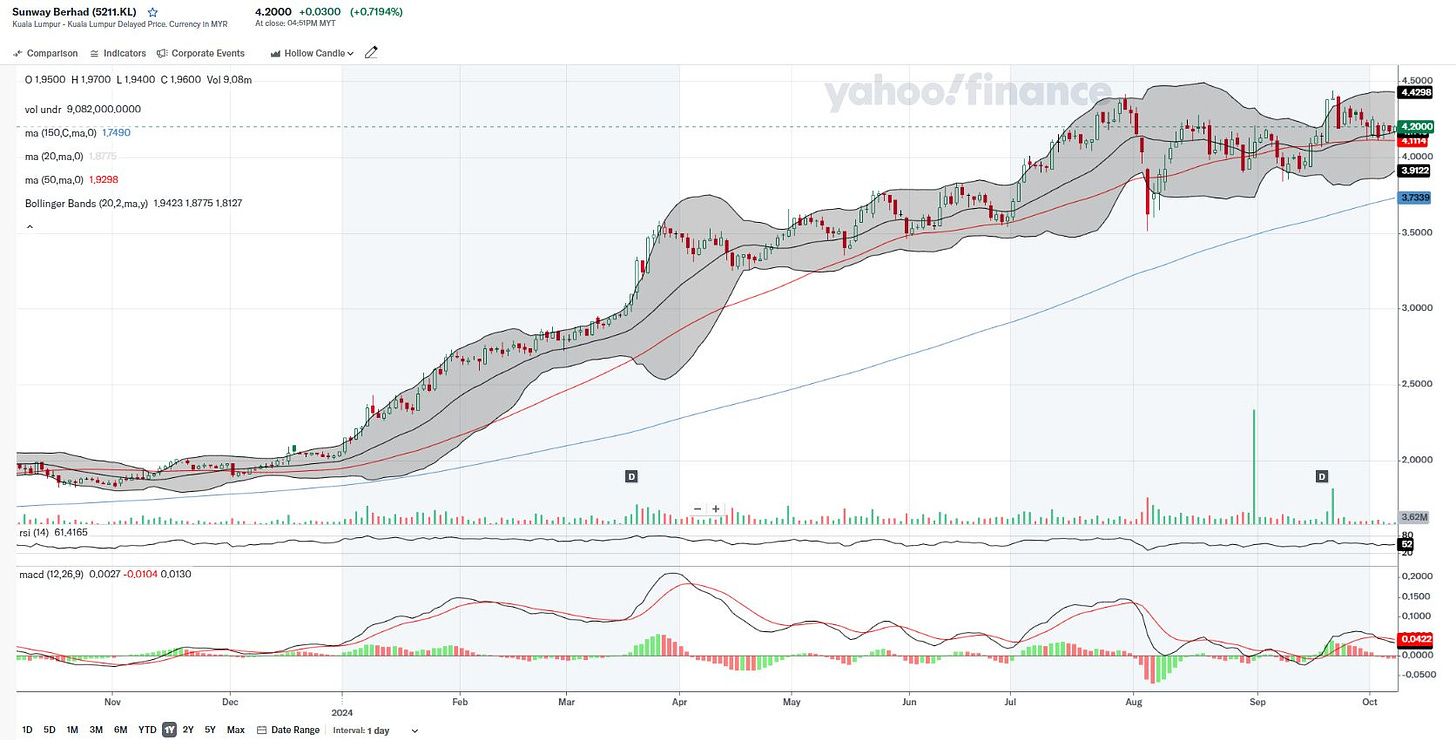
This setup reflects a mature uptrend that may be entering a consolidation phase before either continuing upwards or facing a potential pullback. The overall trend is bullish, but with caution needed around current resistance levels. The chart shows strength but also suggests that traders should be mindful of a potential short-term correction or consolidation.
Themes on the stock:
Integrated Property Development: Focus on building sustainable, mixed-use communities like Sunway City.
Diversified Business Model: Exposure to property, construction, healthcare, and hospitality sectors.
Healthcare Expansion: Growing healthcare arm with Sunway Medical Centre.
REIT Investment: Steady income from Sunway REIT’s diversified portfolio.
Company Background:
Sunway Berhad is a Malaysian conglomerate with key businesses in property development, construction, healthcare, hospitality, and education. Known for projects like Sunway City, it operates Sunway REIT and Sunway Medical Centre. The group's diverse portfolio ensures steady growth across sectors, both locally and regionally.
Details of Technical Analysis:
Uptrend Continuation:
The price action shows a clear uptrend over the past months, with steady higher highs and higher lows, which is a positive technical indicator. However, the recent price consolidation at the top could signal some indecision.
Moving Averages:
The 50-day moving average (MA) and 200-day moving average (MA) both slope upwards, confirming the uptrend. The current price is close to the 50-day MA, indicating possible support. But it is also slightly below the recent highs, suggesting some consolidation pressure.
Bollinger Bands:
The price remains within the Bollinger Bands, with recent touches on the upper band. This suggests the stock has been in an overbought region recently but is now pulling back, potentially setting up for a consolidation or breakout move.
MACD:
The MACD line is slightly above the signal line but with weakening momentum. This divergence could indicate a possible slowdown in the bullish momentum or a correction in the short term.
RSI (Relative Strength Index):
The RSI is around the 61 level, suggesting the stock is not overbought or oversold, leaving room for potential upside if bullish momentum picks up.
Volume:
There has been a noticeable spike in volume recently, indicating strong buying interest. However, it is crucial to see if this volume continues, as declining volume could confirm the consolidation phase.


