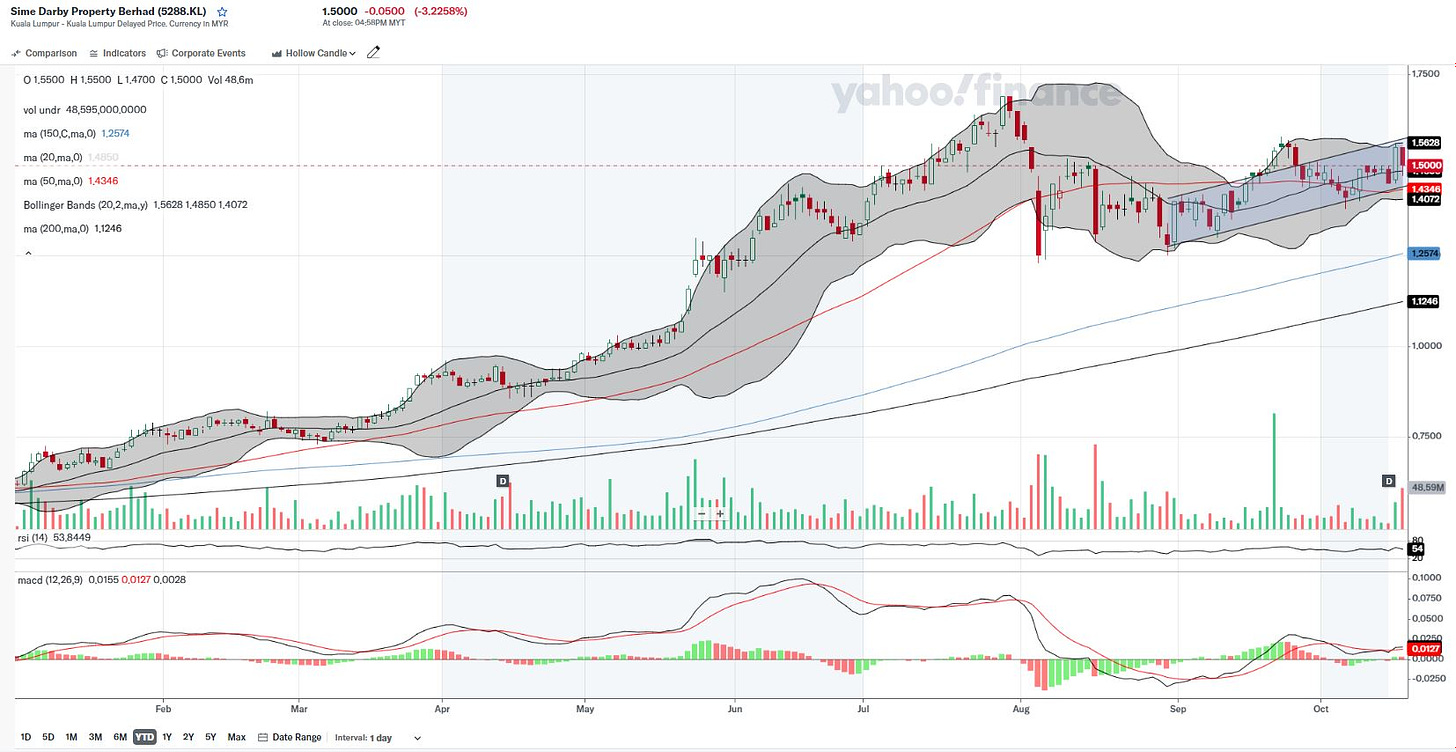
SIMEPROP: Moving Averages Signal Strong Uptrend
Overall Technical Verdict:
The chart setup shows strong bullish signals due to the trend's consistency across multiple timeframes. However, volume is relatively low, and MACD shows some consolidation, indicating a possible pause in momentum. A decisive breakout would further improve the setup.
What are the key themes on the stock?
Sustainable Development: Known for its focus on eco-friendly and sustainable township projects, aligning with global ESG (Environmental, Social, Governance) trends.
Urbanization & Property Demand: Positioned to benefit from rising property demand in Malaysia's urban centers, driven by population growth and urbanization.
Diversified Portfolio: Offers a wide range of properties, including residential, commercial, and industrial projects, which provides stability and resilience across different market segments.
Latest Earnings Update:
For the first half of FY2024, the company achieved a 59% increase in revenue to RM2.2 billion compared to the same period last year. Profit before tax surged by 110% to RM446.3 million, and profit after tax and minority interest (PATAMI) doubled to RM285.5 million. Key drivers of this growth included strong sales momentum across its diversified portfolio and enhanced progress in key developments, including industrial and residential projects. The company has already reached 60% of its full-year sales target of RM3.5 billion. (Source: Company website)
Company background:
Sime Darby Property Berhad is one of Malaysia's leading property developers, involved in developing residential, commercial, and industrial properties. With over 45 years of experience, the company is known for its sustainable township developments and is a key player in transforming urban landscapes across Malaysia.
Details of Technical Analysis:
Trend Strength: The alignment of the moving averages (with shorter MAs above longer ones) indicates a strong uptrend, reinforcing the stock's longer-term bullish bias.
Short-term Strength: The price being above the 20-day MA also suggests that the near-term momentum remains intact, despite recent consolidation.
Bollinger Bands:
The price is within the Bollinger Bands, and while it had previously tested the upper band during its rally, it's now close to the middle of the bands (neutral signal).
A breakout above or below the bands could signal a trend change, but as of now, the price seems range-bound.
MACD (Moving Average Convergence Divergence):
The MACD lines are converging, which indicates a potential change in momentum, but it's not a clear buy or sell signal at this point.
The histogram shows that the momentum has been relatively weak lately, confirming the sideways price action.
Volume:
The recent volume seems relatively low, suggesting a lack of strong conviction from either buyers or sellers at this stage.
RSI (Relative Strength Index):
The RSI is at 54, which is in the neutral range. It's neither overbought nor oversold, so no strong directional signal is evident here.


