PBBANK: Short-Term Pullback or Long-Term Gain?
Overall:
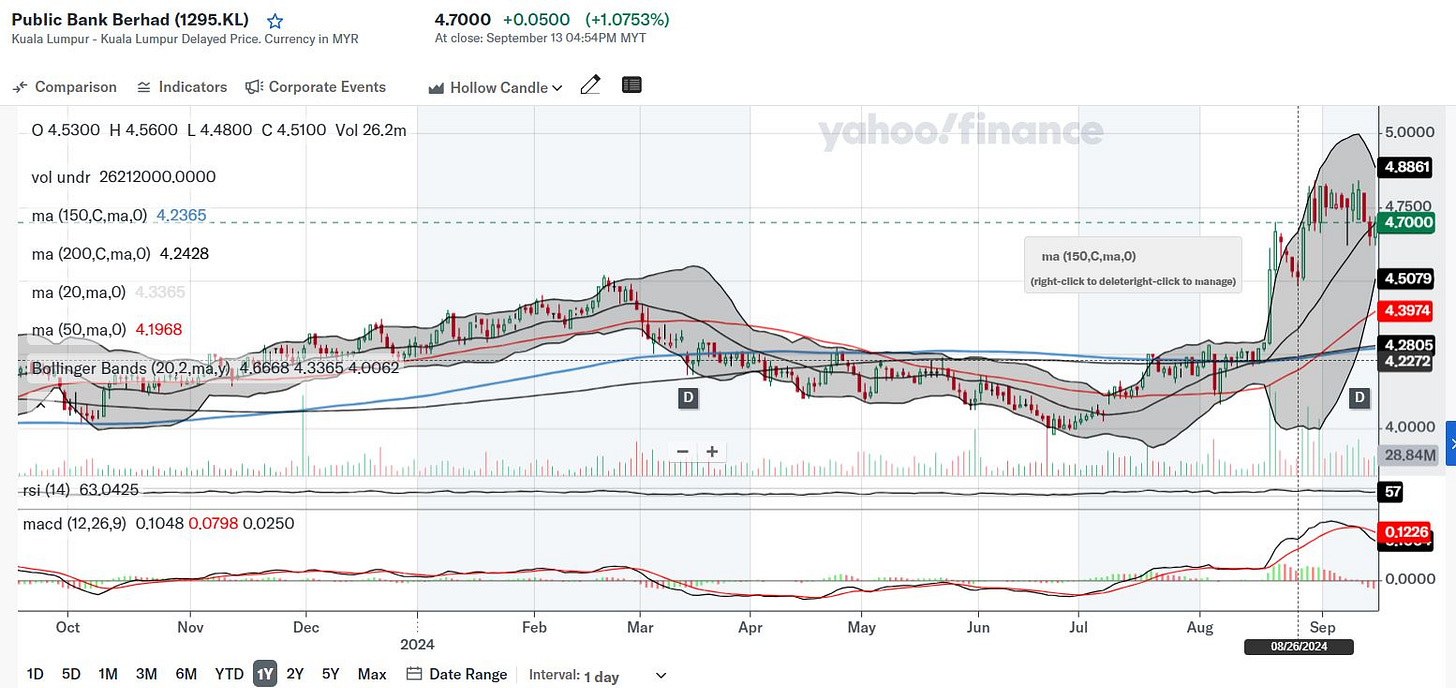
While the overall trend remains positive, the price might face a short-term pullback before resuming its upward trajectory. The stock still has room to rise, but it is essential to watch for any corrections or changes in momentum.
Moving Averages (MA):
50-day MA: The price is trading above the 50-day MA (purple line), which indicates bullish momentum in the medium term.
150-day MA and 200-day MA: The stock is also above these longer-term moving averages, suggesting a strong overall uptrend.
Recent Price Action:
The chart shows a sharp rise in the stock price recently, followed by a consolidation period. It appears that the price is pulling back slightly from a recent high.
Volume:
The trading volume seems elevated compared to earlier periods, which can signify strong market participation during the price increase.
Relative Strength Index (RSI):
The RSI is at 57, which suggests the stock is not overbought or oversold. This provides room for further upward movement without being in danger of an immediate reversal.
Bollinger Bands:
The stock price is hovering near the upper band, indicating strong upward momentum. When the price consistently touches or stays near the upper band, it can signal a continuation of the upward trend. However, overextended moves could also signal a potential pullback.