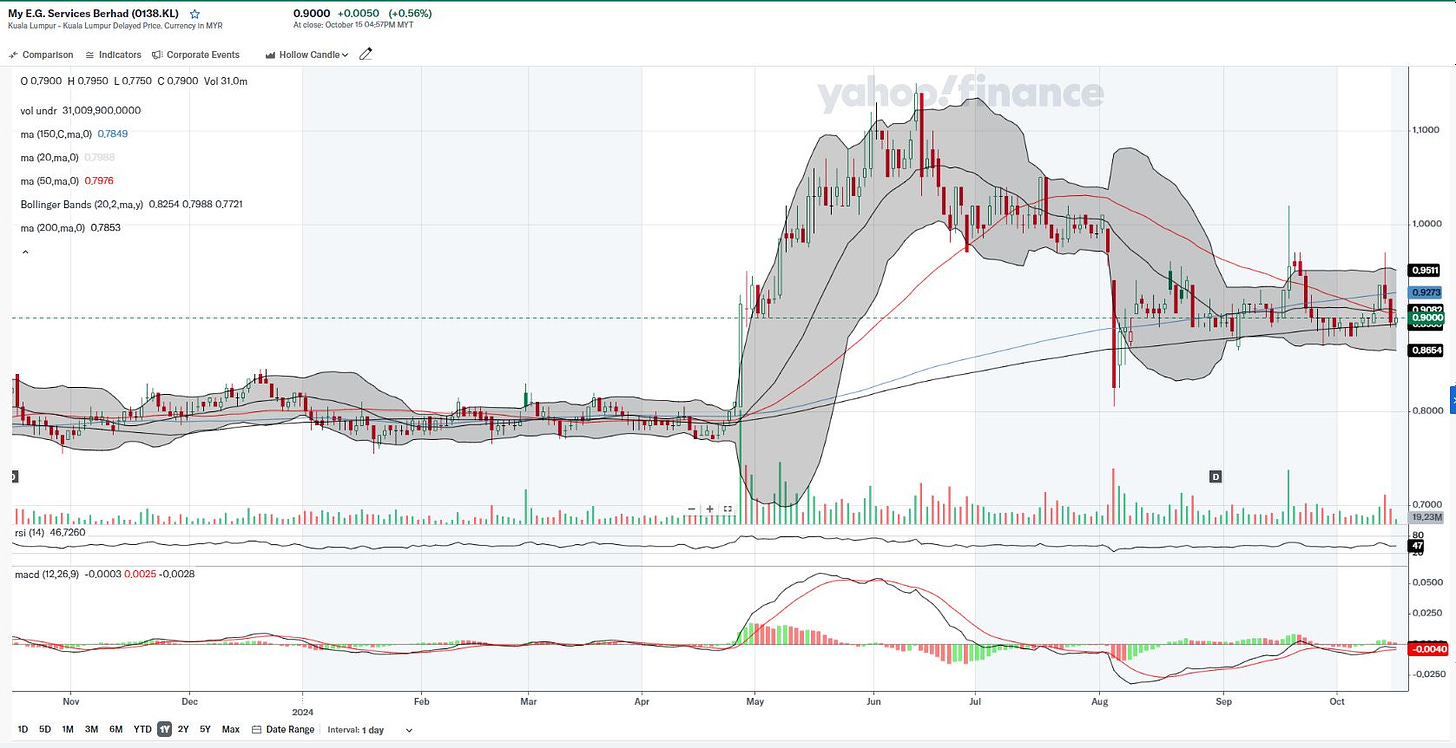
Overall Technical Verdict:
This chart represents a neutral-to-slightly-bullish setup. There is no strong technical signal for an immediate breakout, but it also does not show strong bearish sentiment. It seems to be in a consolidation phase, waiting for a catalyst to move in either direction. The MACD and moving averages suggest that there may be a potential breakout, but confirmation is needed with price action above resistance.
Themes on the Stock:
E-Government Solutions: MYEG provides online government services, streamlining processes such as licensing, tax payments, and immigration.
Digital Transformation: The company is positioned at the forefront of Malaysia's digital shift, leveraging blockchain, AI, and fintech innovations.
Fintech and Payment Solutions: MYEG offers payment gateways, e-wallets, and other fintech services, expanding its ecosystem beyond e-government.
Company Background:
My E.G. Services Berhad (MYEG) is a Malaysia-based digital services provider offering e-government solutions. It facilitates online services like license renewals, immigration processes, and insurance. The company also provides blockchain solutions, fintech services, and healthcare-related tech platforms.
Details of Technical Analysis:
Moving Averages:
The chart displays the 150-day (0.78), 200-day (0.785), 50-day (0.50), and 20-day (0.79) moving averages.
Price seems to be fluctuating near the 50-day and 20-day moving averages, a neutral signal with slight bullishness if it can maintain above them.
Bollinger Bands:
The price is currently moving within the Bollinger Bands, showing consolidation.
There is no breakout above the upper band nor a breakdown below the lower band, signaling indecision.
MACD (12,26,9):
The MACD is showing bearish divergence, as the MACD line (0.0025) is below the signal line (-0.0028), suggesting potential downside pressure.
However, it looks like the lines are about to cross again, which could indicate a bullish reversal.
RSI (Relative Strength Index):
RSI is at 47, which is in the neutral zone. It neither shows overbought nor oversold conditions.
This indicates that the stock is not in a momentum phase, which aligns with the range-bound price action.
Trend: The overall trend seems to be sideways, with no clear long-term uptrend or downtrend emerging. After a strong rally earlier this year, the stock is consolidating.
Support and Resistance: The stock is bouncing near support levels of around 0.865, with resistance at 0.95.
Volume: The volume is relatively consistent with no major spikes, meaning that there isn’t an extraordinary influx of buying or selling pressure.


