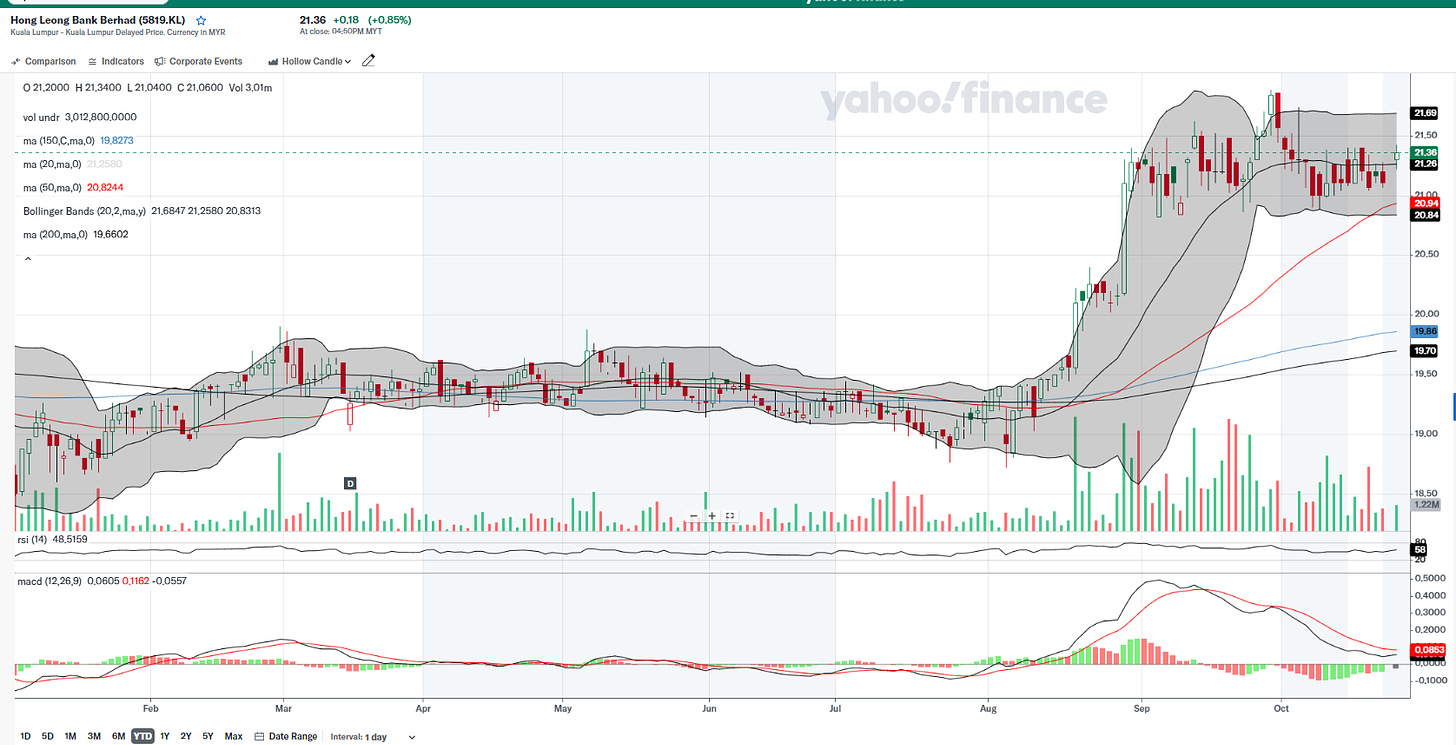
HLBANK Rally Pauses – Is a New Surge Coming?
Overall Technical Verdict:
While the overall trend remains bullish, the bearish MACD divergence and the consolidation phase suggest that the stock may not immediately break out. The moving averages and Bollinger Bands indicate support for the upward trend, but further confirmation is needed for another leg up. The current setup is decent, but some caution is advised for short-term traders. The current consolidation after a strong rally is healthy and suggests that the stock is gathering strength for its next move. However, the bearish MACD signal suggests that in the short term, the stock might face some headwinds or continue to consolidate before resuming its upward trend.
Company Background:
Hong Leong Bank Berhad (HLBANK) is a leading Malaysian financial services group, offering a wide range of banking services such as retail, business, and Islamic banking. Established in 1905, it has grown significantly, serving Malaysia and regional markets like Singapore, Hong Kong, and Vietnam with a focus on digital transformation.
Themes on the Stock:
Digital Transformation: HLB is heavily investing in digital banking initiatives, focusing on enhancing customer experience and operational efficiency through fintech and AI integration.
Regional Expansion: Beyond Malaysia, HLB is expanding in regional markets like Singapore, Vietnam, and Hong Kong, targeting growth in Southeast Asia.
Stable Financial Performance: The bank is known for its steady earnings, low non-performing loans (NPL), and robust asset quality, providing resilience in economic downturns.
Sustainable Banking: HLB has been increasingly focused on Environmental, Social, and Governance (ESG) initiatives, promoting sustainable banking practices and green financing.
Risk Management: HLB's conservative approach to lending, coupled with strong capital reserves, positions it as a stable player amidst market volatility, appealing to long-term investors.
Details of Technical Analysis:
Price Action and Trend
The price has experienced a strong rally since mid-August, climbing from approximately 19.50 to its recent peak of 21.69 in September.
Currently, the price is trading at 21.36, with some consolidation after the recent surge. The consolidation around the upper levels suggests the possibility of a bullish continuation.
While the price has risen significantly, the recent sideways movement indicates some indecision in the market.
Moving Averages
50-Day MA (red): The price is comfortably above the 50-day moving average (20.8420.8420.84), a positive sign for the medium-term trend.
150-Day MA (blue) and 200-Day MA (grey): Both are below the current price (19.8219.8219.82 and 19.6619.6619.66 respectively), supporting a bullish long-term outlook. All the moving averages are aligned in a bullish order (shorter MAs above longer ones), which is typically a positive trend indicator.
Bollinger Bands
The price has recently retraced back into the middle of the Bollinger Bands after pushing the upper limit. This suggests that the sharp upward momentum has paused, but the overall bullish structure remains intact.
Bollinger Bands are squeezing slightly, indicating reduced volatility and a potential buildup for a bigger move in the near future.
MACD
The MACD is showing bearish divergence, with the MACD line below the signal line and the histogram in negative territory. This indicates some loss of momentum in the short term, suggesting the stock may either consolidate further or see a slight pullback.
The gap between the MACD and the signal line is widening, which could point to continued consolidation or a corrective phase.
RSI
The RSI is at 48.51, close to the mid-range, which suggests there is no extreme overbought or oversold condition. This could indicate that the stock has more room to move in either direction, and the consolidation phase might not be over yet.
Volume
Volume has tapered off during the consolidation period, which is typical after a significant price run-up. The drop in volume during consolidation is not necessarily a negative sign; it could imply that traders are waiting for a fresh catalyst to either push the stock higher or reverse it.


