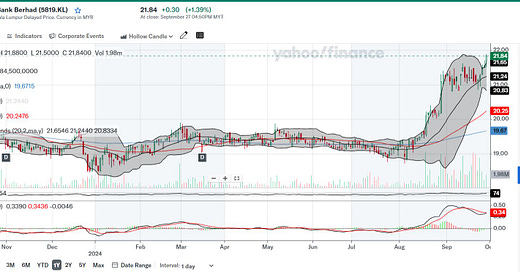
HLBANK: Analyzing the Bullish Signals on the Chart
Overall Technical Verdict:
The price is trending strongly upward, with a bullish moving average alignment. Breakout from previous consolidation indicates strength and potential continuation of trend. Healthy trading volume supports the recent price movement.
However, the stock is overbought based on RSI and Bollinger Band breakouts, signaling possible exhaustion in the short term. MACD is showing early signs of weakening momentum, which could suggest that the current rally might slow down.
The chart shows a solid uptrend, but short-term caution is advised due to the overbought signals. For new investors, waiting for a pullback before entering could provide a better risk-reward setup.
Themes On The Stock:
1. Digital Banking and Fintech Innovation
HLBANK has been investing in digital banking services to remain competitive. The ongoing theme of digital transformation within banking is relevant as more consumers shift towards online banking services. Its ability to innovate in fintech could drive growth and profitability.
2. Regional Exposure and ASEAN Market Growth
HLBANK has regional exposure, especially within ASEAN countries. Economic growth in Southeast Asia, particularly in markets like Singapore, Vietnam, and Cambodia, can provide the bank with expansion opportunities and revenue growth, benefiting from increased cross-border banking demand.
3. Dividend Income and Investor Yield
As a well-established bank, HLBANK is known for paying consistent dividends. It is attractive to income-focused investors looking for stable dividend yields, especially during times of market volatility. Dividend payout trends and sustainability are key themes for long-term investors.
Stock Background:
Hong Leong Bank Berhad (HLB) is a major Malaysian banking group, offering a wide range of financial services including personal, business, and Islamic banking. Established in 1905, it is part of the Hong Leong Group. HLB focuses on digital banking, regional growth across ASEAN, and is known for stable dividend payouts and strong financial performance.
Details Of Technical Analysis:
Price and Volume
A recent price breakout occurred from a consolidation pattern around RM 19.50–RM 20.50 is showing strength. The price has moved up significantly, potentially indicating overbought conditions, which leads to possible pullbacks.
Moving Averages
50-day Moving Average (MA): RM 20.25 – Price is significantly above this level, showing strong upward momentum.
150-day MA: RM 19.67 – This is well below the current price, indicating a longer-term upward trend.
20-day MA: RM 21.24 – Price is slightly above, which is positive for short-term trend continuation.
The setup shows bullish momentum as the shorter-term moving averages are above the longer-term ones (bullish crossover).
Bollinger Bands
The price has broken above the upper Bollinger Band (RM 21.65), indicating a strong upward move. However, this also suggests that the stock might be overextended and due for a potential consolidation or pullback in the near term.
RSI (Relative Strength Index)
The RSI is at 74, which indicates that the stock is entering overbought territory. RSI above 70 suggests caution, as it could signal an upcoming correction or a pause in the upward trend.
MACD (Moving Average Convergence Divergence)
The MACD line (0.34) is slightly above the signal line (0.34), showing marginal bullish momentum. However, the histogram is flat and shows that momentum may be losing steam.