Crescendo: Bulls Take Charge?
Overall Technical Verdict:
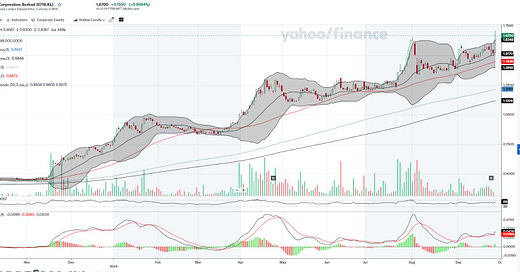
The stock is in a well-established uptrend with bullish momentum, though some indicators (such as RSI and MACD) are hinting at the possibility of a short-term pullback or consolidation. The breakout above recent resistance, combined with expanding Bollinger Bands, suggests the potential for further gains, but caution is warranted due to slightly overbought conditions.
This setup would be suitable for trend-following investors, but one should watch for a possible short-term retracement before continuing upward.
Themes on this stock:
Johor Play: The company sold a few pieces of land to Microsoft in Johor.
Consistent Dividend Payouts: The company has a history of providing dividends, appealing to income-focused investors looking for steady returns.
Resilient Balance Sheet: Crescendo maintains a healthy financial position with manageable debt levels, enabling it to withstand market downturns and capitalize on growth opportunities.
Company Background
Crescendo Corporation Berhad, based in Malaysia, engages in property development, construction, and related services. The company specializes in residential, commercial, and industrial properties while also offering engineering services and investment in education through its Crescendo International College.
Details of Technical Analysis:
1. Trend Analysis
Uptrend: The stock is in a strong uptrend as indicated by the higher highs and higher lows.
Moving Averages: The 50-day, 150-day, and 200-day moving averages are all sloping upwards, reinforcing the strength of the trend. The price is trading above the key moving averages, which is a bullish sign.
Recent Breakout: The stock price has recently broken out above resistance levels near 1.60 MYR, showing a strong bullish momentum.
2. Bollinger Bands
The price is trading near the upper band, indicating that the stock is overbought in the short term, but the bands are expanding, which suggests increasing volatility and the potential for further upside.
There was a consolidation phase where the price traded within a tighter range, but the breakout above the upper Bollinger Band could be a continuation signal for the current trend.
3. Volume Analysis
The volume has increased significantly during the upward price movement, indicating strong buyer interest, but it appears to be tapering off slightly in the last few sessions. A continuation of high volume would be preferred for sustained upside.
4. MACD
The MACD line is above the signal line, suggesting bullish momentum. However, the gap between the MACD line and the signal line is relatively small, which indicates that the momentum may not be as strong as earlier in the trend.
The histogram shows green bars, reinforcing the idea that bullish momentum is in place, but a watchful eye is needed for any sign of divergence or weakening momentum.
5. RSI
The RSI is at 69, close to overbought levels. While not yet in extreme territory (above 70), it does suggest that the stock could be due for a pullback or consolidation in the near term. However, in strong trending stocks, the RSI can remain overbought for extended periods.
6. Support and Resistance
There’s strong support around 1.40–1.50 MYR based on prior consolidation, which gives the stock a solid base. The recent breakout above 1.60 MYR could now act as a new support level.
The next key resistance appears around 1.70–1.75 MYR, which the stock is approaching.