BURSA: Poised for a New Rally or Stuck in Sideways Action?
This post is only available for Substack subscriber
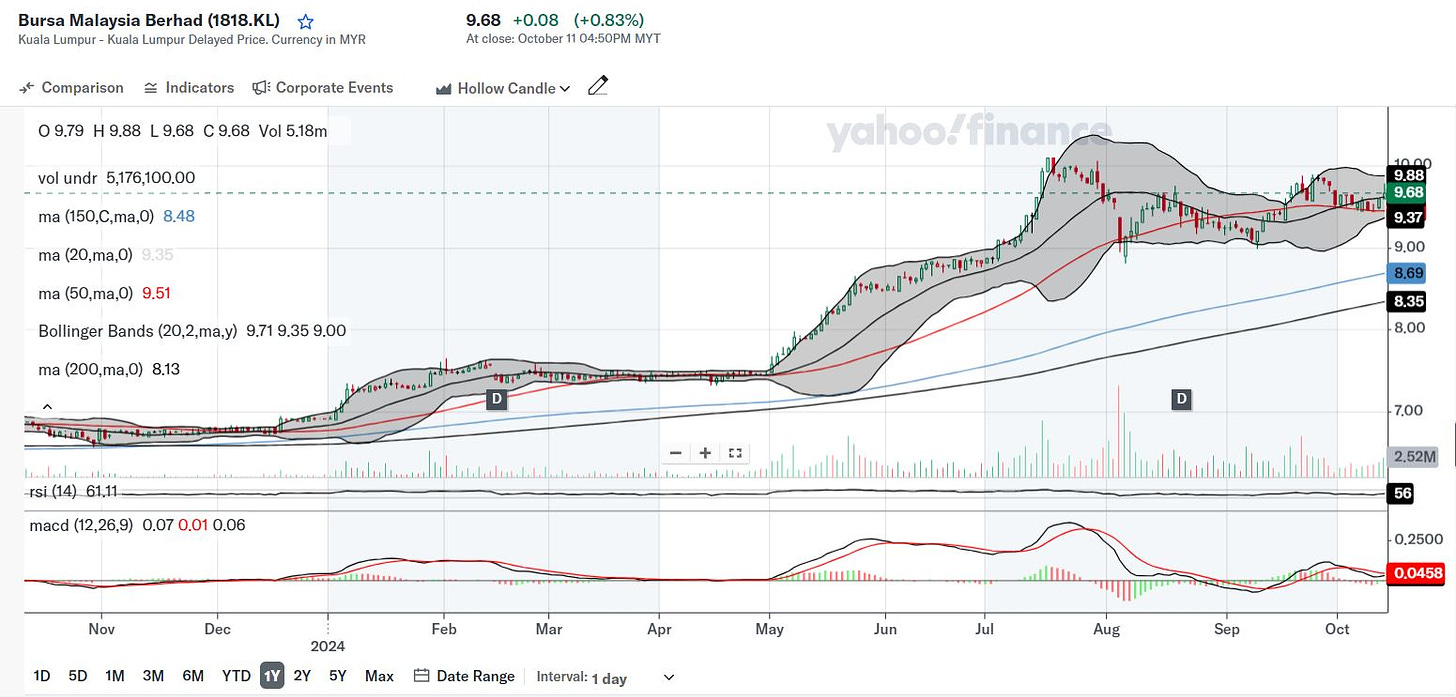
Overall Technical Verdict
Strengths: The stock remains in an uptrend with strong support from longer-term moving averages and has a bullish RSI. However, the Bollinger Bands indicate consolidation and possible breakout, but this hasn't occurred yet.
Weaknesses: The stock is struggling to hold above the 50-day MA, and MACD momentum is weakening. A decisive breakout above the recent consolidation (around RM10) with stronger volume would improve the setup.
What are the Themes on BURSA?
Trading Volumes: Higher trading volumes drive revenue growth through transaction fees.
Economic Growth: As a barometer of the Malaysian economy, stock performance is influenced by GDP growth, consumer confidence, and corporate earnings.
Technological Innovation: Digitalization, trading platform upgrades, and fintech adoption can enhance Bursa's efficiency and attract more participants.
Stock Background:
Bursa Malaysia Berhad operates Malaysia's stock exchange, providing a platform for the trading of equities, bonds, derivatives, and other securities. It offers services like listing, trading, clearing, settlement, and depository functions, catering to investors, companies, and financial institutions.
Details of Technical Analysis:
Price Trend: The stock price has been on a general upward trend, especially noticeable from May to July, with recent consolidation near the RM9.50-10 range. The trend appears stable, but there is a need to break out of consolidation to resume the upward momentum.
Moving Averages (MA):
The stock price is above the 150-day (8.48) and 200-day (8.13) moving averages, indicating long-term bullishness.
Shorter-term moving averages (50-day at 9.51 and 20-day at 9.35) are near current price levels, signaling consolidation. However, the price is slightly below the 50-day MA, which could indicate near-term weakness if it doesn't reclaim this level soon.
Bollinger Bands: The Bollinger Bands (9.71-9.35) are relatively tight, indicating low volatility at the moment. A contraction like this often precedes a breakout or breakdown. The price hugging the upper band could suggest a bullish bias, but without a clear breakout yet, it's neutral for now.
Volume: Volume of 5.18 million seems moderate. There was a spike in volume during the uptrend in June-July, indicating strong buying interest during that period. Current volume is average, meaning no aggressive buying or selling signals.
RSI (14): The RSI at 61 suggests the stock is in the bullish territory but not yet overbought. There's still room for upward movement before hitting overbought levels (~70).
MACD: The MACD (12,26,9) line is slightly positive (0.07) but converging with the signal line, which could indicate a potential bearish crossover if momentum doesn’t pick up soon.


