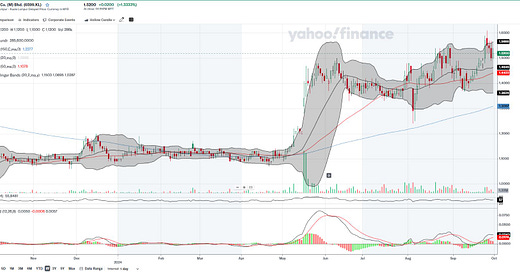
Overall Technical Verdict: Positive due to uptrend and MACD crossover
The stock is in a bullish phase supported by moving averages and a MACD crossover, but the RSI and lower recent volume suggest some caution is warranted, as a pullback could be near. If the volume picks up again and there’s another breakout above resistance, the rating could improve.
Theme On The Stock:
Retail Recovery Post-Pandemic: With consumer sentiment improving, Aeon Co. may benefit from increased foot traffic and spending in its malls and stores as the economy rebounds.
E-Commerce Integration: Aeon's efforts to expand its online presence and integrate digital strategies with physical retail operations could drive growth in the increasingly digitalized retail environment.
Dividend Play: Aeon Co. has historically been a stable dividend payer, making it attractive to investors seeking steady income from consumer-focused stocks.
Strong Ringgit To Encourage Consumer Spending: The trend of stronger Ringgit is positive to AEON as it boost sales of affordable essentials.
Stock Background:
AEON operates retail stores and shopping malls across Malaysia, offering a range of products from groceries to fashion, electronics, and household goods. The company focuses on both physical retail and e-commerce platforms, catering to middle-income consumers with diverse product offerings.
Details Of Technical Analysis:
Volume: There was a significant volume spike during the rally, which is a good confirmation of the uptrend. However, recent volumes appear lower, which could indicate that the momentum is slowing.
Candlestick Pattern: The price action shows a series of bullish candlesticks after a strong uptrend, but there is some consolidation and hesitation near the current levels, indicating a possible retracement or period of sideways movement.
Bollinger Bands: The price recently broke above the upper band, which often signals either strong momentum or potential overextension. The price has stayed within the bands, suggesting a possible consolidation phase.
Moving Averages (MA):
The 50-day MA and 20-day MA are close, showing no strong divergence. The price is above both, suggesting a bullish trend.
The 150-day MA is well below the current price, indicating long-term strength in the trend, though it hasn’t been tested recently.
MACD: The MACD is showing a bullish crossover (the black line crossing above the red line), signaling potential upward momentum. This is typically a good sign for further upward movement.
RSI: The RSI is around 55, which suggests the stock is not yet overbought. This level of RSI is neutral to slightly bullish, indicating there's still room for the stock to move higher.