ABMB: Ready to Soar or Due for a Pullback?
Overall Assessment:
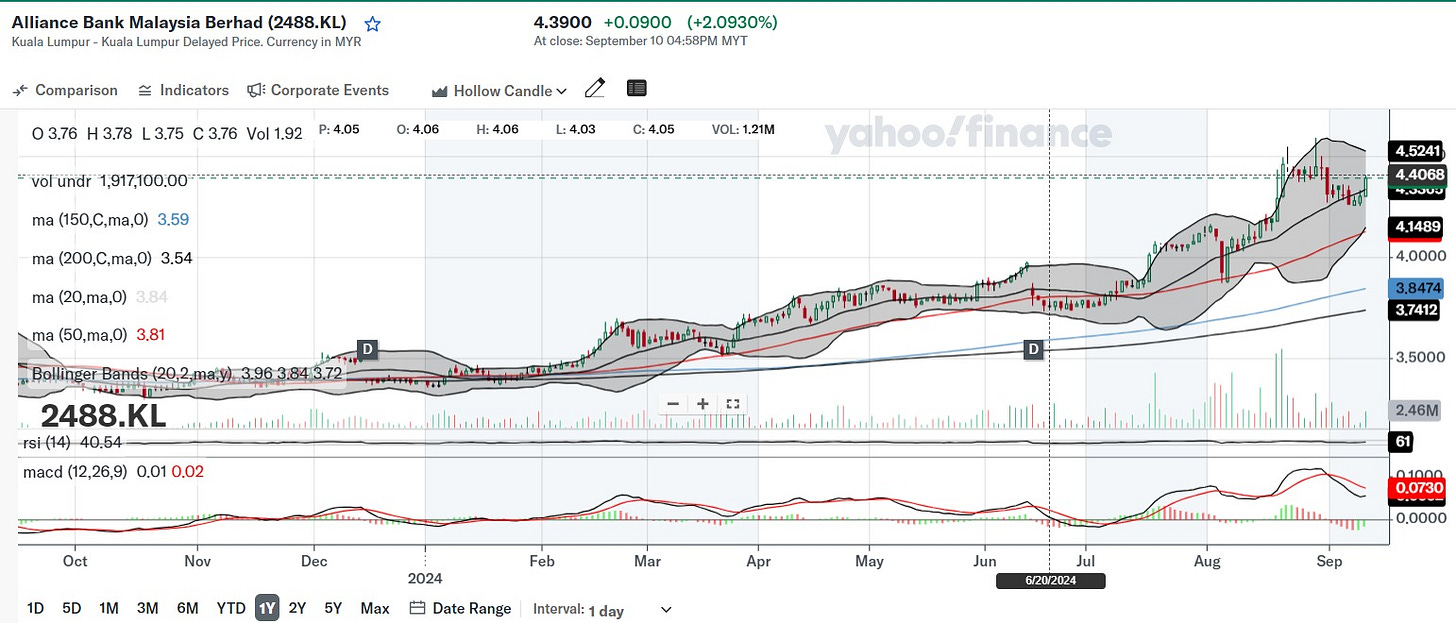
The stock is in a strong long-term uptrend, as indicated by its position relative to the 200-day and 50-day moving averages. The price is consolidating after a recent rally, as indicated by the proximity to the 20-day MA and the neutral MACD.
The RSI shows no signs of being overbought, which is a good sign for further upward potential. However, the low volume and neutral MACD suggest that the stock may need more momentum or a catalyst to push higher.
What is the theme on this stock?
Strong Malaysia GDP
Ringgit appreciation which bode well for banking sector
Laggard play in the banking sector
Stock background:
Alliance Bank Malaysia Berhad is a full-service commercial bank offering a range of banking and financial services including consumer banking, business banking, Islamic banking, and investment services. It serves individuals, SMEs, and corporations with products like loans, deposits, and wealth management.
1. Moving Averages (MA)
50-day MA: The stock price is currently above the 50-day moving average (3.81), which is a positive sign.
200-day MA: The stock is significantly above the 200-day moving average (3.54), indicating a strong long-term uptrend.
2. Bollinger Bands
The stock price is within the upper region of the Bollinger Bands, but not overextended, indicating a potential for further upside.
The bands are slightly widening, suggesting increasing volatility, which could lead to more pronounced price movements.
3. Relative Strength Index (RSI)
The RSI is at 41, which is below the neutral level of 50. This indicates that the stock is not overbought, and there could be room for upward movement.
4. MACD
The MACD line is very close to the signal line, and both are near the zero line, indicating a neutral momentum. This could suggest that the stock is waiting for a catalyst to break either way.
5. Volume
The volume is relatively low, indicating that the recent price movements may not be strongly supported by investor participation.